Page 71 - Building Journal - May 2017
P. 71
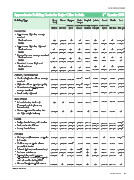
BUILDING COSTS
rd
Approximate Building Costs for major Cities in Asia 3 Quarter 2016
Building Type Hong Macau Singapore Kuala Bangkok Jakarta Brunei Manila Seoul
Kong Lumpur
USD / m2 CFA (See also exchange rates per U.S. dollar below)
HK$7.80 MOP 7.98 S$1.35 RM 4.05 BAHT 34.43 IDR 13,135 B$1.35 PHP 47.00 KRW 1,120
DOMESTIC
˙ Apartments, high rise, average
standard
- Shell and core N/A 1,679-2,481 N/A N/A 494-581 N/A N/A N/A 1,027-1,223 Δ
- Full fit 3,140-3,690 2,143-2,632 1,410-1,595 75-505 $ 624-755 682-772 776-1,066 894-1,001 1,375-1,670 Δ
˙ Apartments, high rise, high end
- Shell and core N/A 2,481-3,709 N/A N/A 595-770 N/A N/A N/A 1,071-1,321 ΔΔ
- Full fit 4,240-4,940 3,008-4,586 2,150-3,185 780-930 929-1,104 940-1,061 959-1,248 1,190-1,477 1,652-2,054 ΔΔ
˙ Terraced houses, average standard
- Shell and core N/A 2,932-3,647 N/A N/A 290-378 N/A N/A N/A N/A
$$
- Full fit 4,310-5,030 3,672-4,373 1,815-2,040 225-325 436-523 362-470 502-792 783-947 N/A
˙ Detached houses, high end
- Shell and core N/A 3,546-5,113 N/A N/A 508-726 N/A N/A N/A 1,036-1,295
- Full fit 5,580-6,350 4,461-5,802 2,300-3,040 755-940 755-915 940-1,100 764-1,053 1,550-2,000 2,241-3,429
OFFICE / COMMERCIAL
@
$$$
#
˙ Medium/high rise offices, average 3,080-3,650* 2,481-3,195 1,815-2,000 610-710 610-755 673-745 776-1,066 790-928 1,223-1,420
standard
##
$$$
@
˙ High rise offices, prestige quality 3,820-4,710 3,195-3,496 2,000-2,225 885-1,200 799-1,017 992-1,108 1,098-1,387 1,210-1,405 1,411-1,759
˙ Out-of-town shopping centre, 3,140-3,690 2,331-3,496 2,000-2,150 540-650 595-770 577-639 753-1,043 703-906 1,152-1,786
average standard
˙ Retail malls, high end 4,180-4,960 3,672-4,398 2,150-2,370 685-870 799-828 638-690 994-1,283 1,104-1,286 1,339-2,232
INDUSTRIAL
˙ Industrial units, shell only. N/A N/A 765-980 325-410 465-581 310-337 358-648 459-528 670-857 ΔΔΔ
(Conventional single storey
framed units)
˙ Owner operated factories, low 2,410-3,060 N/A N/A 440-500 N/A 337-371 488-777 620-683 N/A
rise, light weight industry
HOTEL
˙ Budget hotels-3-star, mid market 4,010-4,330 3,258-3,684 2,260-2,445 1,020-1,425 1,089-1,205 1,168-1,380 1,468-1,757 1,123-1,341 1,670-2,116 ΔΔΔΔ
˙ Business hotels-4/5-star 4,210-4,970 4,424-5,288 2,890-3,260 1,765-2,065 1,394-1,597 1,596-1,725 2,070-2,360 1,356-1,775 2,339-4,036 ΔΔΔΔ
˙ Luxury hotels-5-star 4,920-5,710 5,288-6,253 2,890-3,260 1,965-2,290 1,627-1,743 1,699-1,915 2,125-2,415 1,803-2,041 2,598-4,152 ΔΔΔΔ
OTHERS
˙ Underground/basement car parks 2,370-2,950 1,930-2,845 980-1,335 365-505 523-683 478-586 N/A 493-580 955-1,125 ΔΔΔΔΔ
(<3 levels)
@@
˙ Multi storey car parks, above 1,470-1,730 1,065-1,404 690-980 230-280 174-279 310-337 398-687 473-634 589-777
ground (<4 levels)
$$$$
˙ Schools (primary and secondary) 2,590-2,810** 2,130-2,481 N/A 240-270 N/A N/A 582-872 721-809 1,339-1,589
˙ Students' residences 2,540-2,950 1,704-1,967 1,670-1,815 295-320 $$$$$ N/A N/A 681-970 710-811 1,402-1,518
˙ Sports clubs, multi purpose 3,970-4,490 N/A 2,075-2,225 590-650 N/A 1,049-1,573 1,566-1,856 1,134-1,564 N/A
sports/leisure centres (dry sports)
with a/c and including FF&E
˙ General hospitals-public sector 5,130-5,830 N/A 2,890-3,040 880-1,095 N/A N/A 1,760-2,050 1,407-1,521 N/A
Source: ARCADIS
Building Journal 69